IBM DataPower Operations Dashboard v1.0.8.5
A newer version of this product documentation is available.
You are viewing an older version. View latest at IBM DPOD Documentation.
Agents
- Copy Page Tree
- Avi Falah
- Assaf Cohen (Deactivated)
The Agents screen is accessible by logging into the Web Console and navigating to [Manage→Internal Health→Agents].
DPOD agents are responsible for collecting data (either actively or passively) from monitored devices and storing it in the Big Data Store. This screen allows you to verify that the agents are up and running.
The screen shows two sections:
- Agent Status - Showing the state of all the agents
- Agent Processing Status- Showing streaming and memory consumption data
Agent Status
The Agent Status section of the screen is a set of 3 widgets, each displaying data related to a different set of DPOD Agents: Syslog, WS-M and Resources. The agents are monitored internally by a KeepAlive service. For a list of all system services, and an explanation on KeepAlive processing, see section on System Services Management.
Each collector agent is displayed in a colored box (see below). Click an agent's name to open its details in the Agent's Detail view.
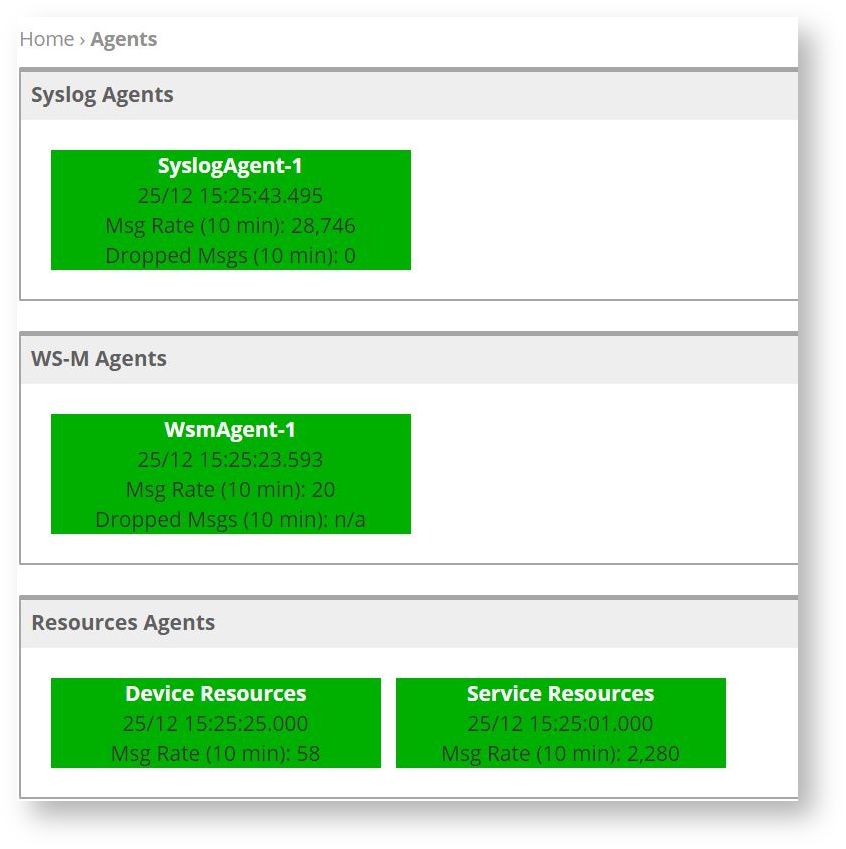
The table below describes the details presented for each agent:
| Detail | Description | Desired State |
|---|---|---|
| General Health Status | The general health status of the agent is relayed by the color of the box wrapping its details.
Possible agent issues :
| Green - the agent is healthy. |
| Date / Time | The timestamp of the last successful record processed by the agent (Syslog record or Keepalive check). A delay of over a minute may suggest a performance problem. Note: It is important to verify that system time is time synced correctly when reading these values. | < 3 minutes |
| Msg. Rate | This is the total number of messages of all types (syslog, WS-M, and keepalive messages) processed by this agent in the last 10 minutes. Verify:
You may redirect syslog traffic from one agent to another by assigning it to a domain a specific agent. For more details see Adding Monitored Devices. | 1 < value < 500,000 (if there are any monitored devices) |
| Dropped Msgs (For Syslog and WS-M agents) | This is the total number of syslog or WS-M messages that were sent from the monitored devices but were not processed by the DPOD agent in the last 10 minutes. Dropped messages usually indicate that the agent cannot keep up with the load, consider redistribution of traffic to other agents. | 0 |
If you encounter any problems, see how to Troubleshoot links to agent status troubleshooting.
Agents processing status
The bottom of the screen displays the agents processing status graphs, which relay the state of processing agents.
| Graph | Details | Desired State |
|---|---|---|
| Files Process Pending | The graph depicts the number of large payloads waiting to be processed. A value higher than 1000 indicates a high load on WS-M subscription. WS-M usage should be avoided until this folder is cleared by the system or you clear it manually. | Only a few files displayed |
Channel Utilization | The graph depicts stream processing usage in percentage. Each colored graph denotes a different agent. Verify that all agents use less than 80% of their stream processing capacity. If usage goes above 80%, data coming in from collector agents might be lost. | Under 80% for all agents |
Agents Free Memory | The graph depicts the collector agents’ free memory over time, where each agent is denoted in a different color. When an agent's free memory is too low, you might encounter performance problems. See how to Troubleshoot the issue. | Verify that each agent |
Agent's Detail View
When clicking an agent name on the Agent Status screen, DPOD opens the agent's details in a single-agent details view.
The Agent Details view is composed of 4 widgets (for syslog and WS-M Agents) or 3 widgets (for Resources Agents).
Agent Details
The agent details widget displays the following information for the agent:
| Detail | Description |
|---|---|
| IP | The IP where this agent runs |
| DNS | The DNS of the agent (if set) |
| Port | The port the agent is listening on |
| Keepalive | On / Off state of the keepalive service for this agent |
| Dropped Msgs (10 mins) | How many messages were lost by the agent |
| Message Rate (10 min) | Number of messages handles by agent in the last 10 minutes |
| Newest Message | Timestamp of the latest message received on this agent |
Recent Keep-Alive Messages
This widget displays a table with details of recent keep-alive messages received on this agent. Scanning this table for changes in frequency may help catching issues.
The following information is displayed for each message:
| Column | Description |
|---|---|
| Device | The device emitting the message. Click on the device name to view the device in the Raw Messages view. |
| Domain | The domain for this message |
| Category | Always montier-ka |
| Severity | Always debug |
| Time | Timestamp for the Keep-Alive message |
| Direction | N/A |
| Object Type | N/A |
| Object Name | N/A |
| Trans. ID | N/A |
| Client IP | This will always be the originating host so 0.0.0.0 |
| Message | Keep-Alive message text. |
Agent Statistics
| Graph | Description |
|---|---|
| Message Rate (per sec) | This widget displays a graph of the number of messages per second going through this agent over the last 24 hours period |
| Dropped Syslog Messages | This graph shows the number of messages dropped by the agent. This value is cumulative , the agent will reset it to zero only after restart. |
| Channels Utilization | The graph depicts stream processing usage of the current agent in percentage. |
| Free Memory | The graph depicts the collector agent free memory over time. |
Reporting Domains (24 hrs.)
This widget lists the domains reporting in the preceding 24 hours period.
The list may be used to identify that a device has dropped off the monitoring list.
| Column | Description |
|---|---|
| Device Name | Name of reporting device |
| Domain Name | Name of reporting domain |
Recent Resources Messages
This widget displays only for the Device and Service Resources Agents. It lists recent resource messages in a table.
Resource messages are status messages where the resource relays the status of its resource consumption.
For each resource message, the table displays the following details:
| Column | Description |
|---|---|
| Device ID | ID of the device this resource message relates to |
| Device Name | Name of the device this resource message relates to |
| Load Time | Timestamp when the load sampling was taken |
| Load | Load sampling value |
| Memory Time | Timestamp when the memory sampling was taken |
| Used Memory | Memory used sampling value |
| Total Memory | Total memory for the device |
| Total Memory % | Percentage of total memory used at sampling time |
| CPU Time | Timestamp when the CPU usage sampling was taken |
| CPU | CPU usage (%) at sampling time |
Monitored Devices (24 hrs.)
This widget displays only for the Device and Service Resources Agents. It lists the devices monitored by DPOD in the preceding 24 hours period.
The list may be used to identify that a device has dropped off the monitoring list.