IBM DataPower Operations Dashboard v1.0.8.5
A newer version of this product documentation is available.
You are viewing an older version. View latest at https://ibm.biz/dpod-docs.
Internal Health Alerts
- Assaf Cohen (Deactivated)
- Avi Falah
- Shachar Greenberg
DPOD automatically runs several self diagnostic tests (checks) on the following internal components:
- Derby Database availability
- ElasticSearch (the Big Data Store) availability
- File system free space
- Internal Big Data Retention process
- Dropped syslog messages
- Dropped WS-M messages
- Syslog and WS-M agent status
and restarting the keepalive service via app-util.sh
The internal alerts can be published in three ways:
- Via Email - from the system parameters page, change the value of "Internal Alerts - Send Email on Alert" to "true", and enter the email destination/s (comma separated) in "Internal Alerts - Email Destination Address for Alerts" - you'll need to restart the keepalive service via app-util.sh for the change to take effect
- Via Syslog - from the system parameters page, change the value of "Internal Alerts - Send Syslog on Alert" to "true", the syslog destination is identical to the destination of the normal system alerts, and can be configured from the parameters "Hostname of the target server for syslog alerts" and "Port of the target server for syslog alerts" - you'll need to restart the keepalive service via app-util.sh for the changes to take effect
- As a notification in the web console, you can change the interval of the alerts from the user preferences page
Internal Alerts Page
The internal alerts page showing current and historic alerts.
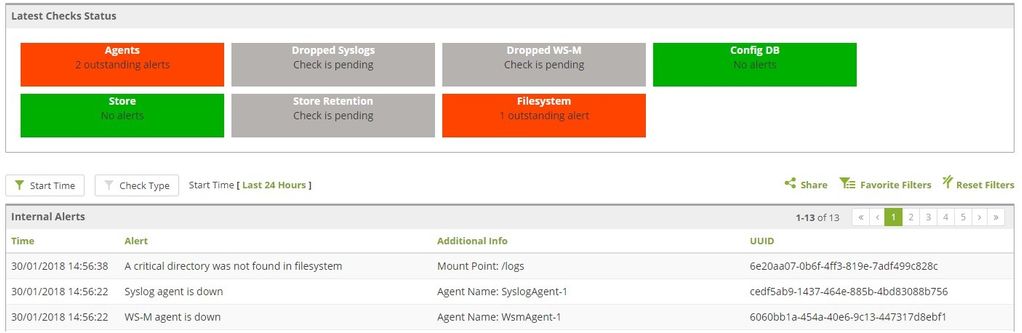
The page is divided into two sections - the top section shows the status of each check
Green - No problems detected
Red - One or more issues were detected, or the previous schedule check did not run (because of a problem with DPOD for example), but a previous check detected a problem.
Grey - The check did not run yet - some checks only start a few minutes to an hour after DPOD starts up - this is normal and does not indicate on any problems.
The bottom section shows a table with all the alerts (current and historical)
| Name | Description |
|---|---|
| Time | The time where the internal alert was generated |
| Alert | Description of the internal alert - for example "Syslog agent is down" |
| Additional info | Any other diagnostic information - for example "Agent Name: SyslogAgent-1" |
| UUID | An internal UUID , you can search for this UUID in the logs when instructed to do so by support personal |