IBM DataPower Operations Dashboard v1.0.8.5
A newer version of this product documentation is available.
You are viewing an older version. View latest at IBM DPOD Documentation.
Payload capturing using WS-M does not provide results
- Amit Munwes
- Former user (Deleted)
There are several reasons why payloads may not show in DPOD:
- Payloads capture is not supported
- Payloads are not being sent
- Payloads capture has errors, or filtered out in DPOD
- Payloads are fully collected in DPOD, but are still not displayed
Perform the following checks to find the cause in your case:
Payloads capture is not supported
Payload capture is only supported for:
1) WS Proxy objects in any firware 6.1.X and above
2) MPGW objects from IDG firmware 7.5.2 and DPOD 1.0.2 (text payloads only)
To see payloads on a non-supported object type and/or versions please upgrade or submit an RFE.
Payloads are not being sent
Perform the following to verify that payload capture is enabled:
- Verify WS-M capturing is enabled: by following the directions under WS-M setup for device and WS-M Subscriptions for All Domains (Optional) as they appear in Adding Monitored Devices
- Verify on your IDG that the subscriptions are created: In the expected domain navigate to Status → Web Service → WSM Agent Status (see blue hilight in the screenshot below). You should see 1 Active subscriber of polled type (see red highlight).
If payloads were captured then they will be reported as Records seen.
Additional statistic data can be seen on WSM: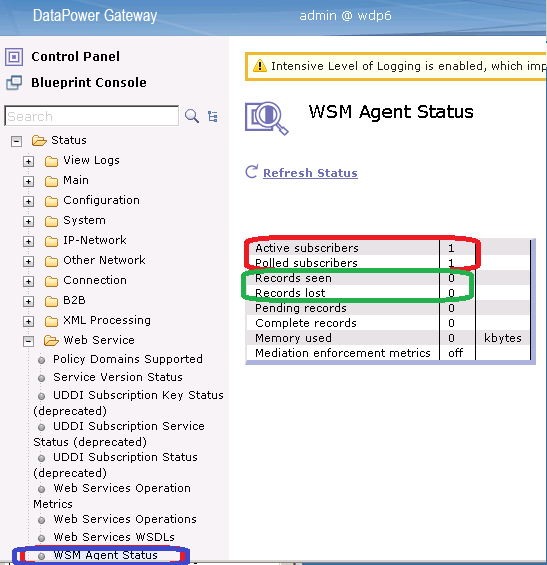
- If Records Seen value is 0, this may mean you do not have running transactions
- If Active Subscribers value is 1 and the value of Polled Subscribers is 0 - ensure you have followed the next step:
- Check that the WS-M Agent in IDG is configured correctly:
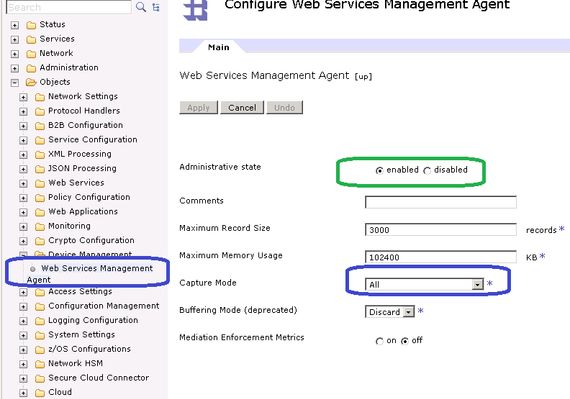
- DPOD expects the WS-M Agent to be enabled and Capture Mode to be set to All
- If your WS-M agent is enabled in IDG, you can create a subscription on DPOD by performing step WS-M Subscriptions for All Domains (Optional) on Adding Monitored Devices. If the Records Seen counter increases by any running transaction - then the payload should arrive at the DPOD WS-M Agent
Payloads are sent but filtered out
If you know that payloads are sent to the DPOD WS-M agent but still can not see them, follow the steps below to ensure they arrive and are being processed.
- Verify the DPOD WS-M agent is up and running - Check System Services Status with the CLI.
- Verify that the DPOD WS-M agent status is green on Check System Status Using the Web Console. This means that the keep alive message are processed.
Inspect the WS-M logs for any exceptions. Logs may be accessed using Telnet, at the following path: /logs/wsmAgents/<Agent-name>/agent-flume_<Agent-name>.log.
Normal WS-M log records should show:11/10/XXXX 08:26:03,477- INFO o.m.a.f.h.NHttpFileServer [I/O-dispatch-2] wsmHttpSource1 Incoming entity content (bytes): 2908. ← an actual payload arrived
11/10/XXXX 08:26:10,166- INFO o.m.a.f.h.NHttpFileServer [I/O-dispatch-3] wsmHttpSource1 Incoming entity content (bytes): 2220. ← size 2220 means usually keep alive message
To find exceptions in your logs, enter the search term ' ERROR ' (leading and trailing space). Contact support with any exception found.
- In some cases DPOD may filter messages out because of their size. Please see the following technote: WS-M large payloads are not displayed
Payloads are fully collected in DPOD, but are still not displayed
This is usually caused because of bad synchronization of time and timezones between IDG and DPOD.
- You should see your transaction in DPOD (without payload) under Investigate → Transaction.
- You will be able too see your payload if you go to DPOD Web console → Manage → Internal Health → Store and click the ES-Head button at top right corner.
- Once inside ES-Head click on the "Browser" tab and scroll down to find wdpWsm under the Types header on the left hand side. Click wdpWsm.
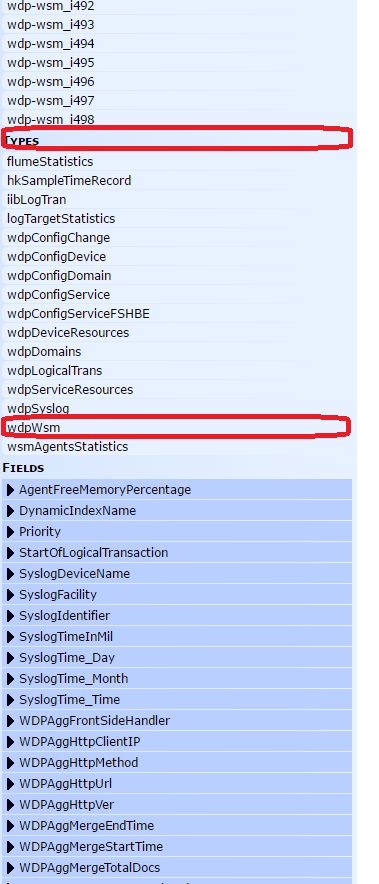
- Find transaction-id under Fields and a list of fields and enter the transaction id you are interested in.
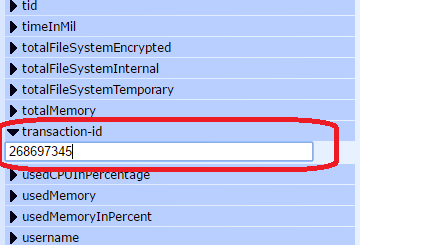
- Scroll back up to the top. Your payload now appears. click on it to view a JSON payload.

- In the JSON locate the start-time field.
"start-time": "1476237603"
this is an epoch time. Use an online epoch converter to find the time of payload. Compare this to the transaction time as displayed under Investigate:
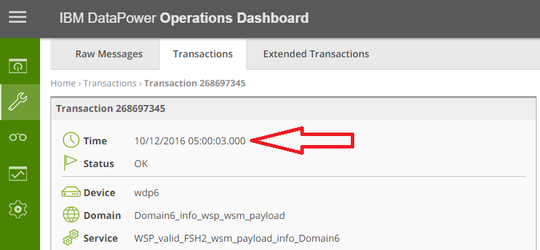
- These should be the same (or within 5 minutes). If they are not - you need to adjust time and timezones in both IDG and DPOD.
As best practice, you should configure both IDG and DPOD to the same NTP source.